‘Come rain come shine’
Text Steve Woodhall Photographs Steve Woodhall and as credited
Why do butterfly numbers fluctuate so much from year to year?
Our editor, Paolo Candotti hit me with a curve ball earlier this year. Why did we see lots of butterflies during The Pandemic, but hardly any since? Was it Climate Change, or something else like observer effects? Having published this article in 2020, he was a bit concerned that it might be a bit too much of an overlap. But reading that, the answer was… well… maybe yes… but there are probably other factors in play.
Lockdown butterflying and afterwards
There was another article published in 2020 in LE that dealt with this. I recorded 91 species of butterflies in the garden that year. Over time I’ve seen there 120 species, and it’s become more difficult to keep track of them recently because my records are split across two different datasets – my app and iNaturalist. However, in Jan to June 2020 I recorded 89 species – over the same period in 2021, only 50. 2022 was a real washout – only 60 species all year. By 11 May 2023 I had seen at least 70 species. Numbers are increasing again, and as usual for Durban, most are seen in the first half of the year. Here’s a few examples:

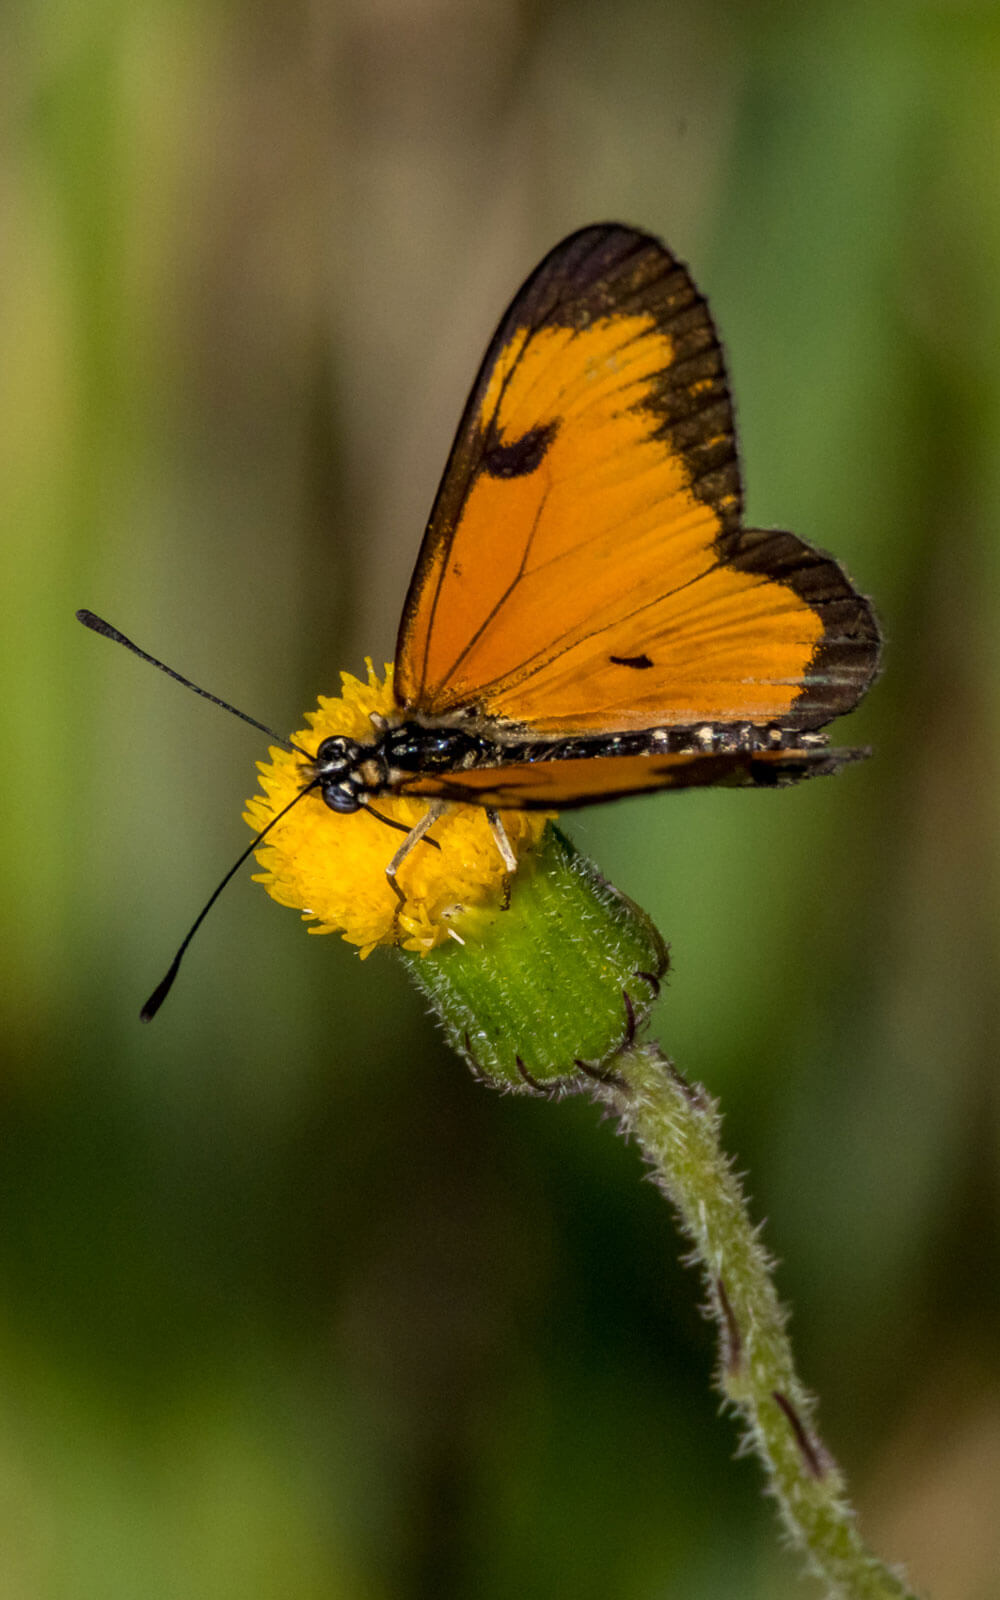
Lowland Bush Beauty, Paralethe dendrophilus indosa, is once again common in the area – but they only started to appear at the end of March.

Clouded Mother of Pearl Protogoniomorpha anacardia is once again appearing after being absent for a couple of years.

We are starting once again to find unusual butterflies. Streaked Sailer Neptis goochi.

Dead-leaf Commodore Precis tugela, having lost half a hindwing, in the garden of fellow LepSoc member Peter Smith in Assagay.
Mark Liptrot and I have recorded several new species recently. He was the first to find Streaked Sailer, down inside Krantzkloof Nature Reserve. Then one turns up in the garden! The Kloof list is now up to 202 species with a couple of other new records we’ve made.

Inside Krantzkloof Nature Reserve the Shire Vernonia Baccharoides adoensis was heaving with butterflies and one of them was this new record for the area, Trimen’s Ciliate Blue Anthene otacilia
Why the sudden burst of species after two lean years?
The weather and butterflies
The British have been hunting and recording butterfly numbers for over three centuries and of course they invented bad weather! Since the heatwave of 1976 records of butterfly abundance have been kept alongside weather data. Several scientific papers have been published describing the relationship. Here are the salient points:
- Strong associations exist between weather and population fluctuations and trends.
- Main positive associations are with warm summer temperatures in the current and previous years, low rainfall in the current year, and high rainfall in the previous year.
- Negative associations exist between increased cloud cover and reduced butterfly abundance.
- Species with moist or semi-shaded habitats increased following high rainfall and cooler weather in the previous year.
Intuitively, this makes sense. Because butterflies’ larval and adult stages have different needs, they have different climatic indicators.
- Larvae need plenty of host plant food and cover to hide them from predators.
So high rainfall favours them. - Adults need warm sunny weather to be active, feed, mate and lay eggs.
So high temperatures and low cloud cover favour them.
Few will argue that we’ve had fluctuating weather conditions in Durban over the past few years! And as Paolo mentioned, butterfly numbers have also fluctuated. Are we able to test whether these observations from the UK hold up in our area? Is there a link?
Butterfly counting
Butterfly Conservation UK (BCUK), whose data was used to generate the stats in those papers, is a very strong organisation with over 40,000 members and 31 local branches. Each year they do a ‘Big Butterfly Count’ and carry out regular repeat counts over the same locality for the same time, at the same time of year. As a result, they have a huge database with temporal, geospatial, climatic, and species data going back to 1976.
The Lepidopterists’ Society of Africa is much smaller – only around 400 members, the branches are provincial rather than local, and we cover a much bigger area. We have LepiMAP and iNaturalist to record species sightings, but they don’t allow abundance data to be directly recorded. With those limitations in mind the current President, Jeremy Dobson, instituted a way to estimate abundance from members’ daily single site records each month, called the ‘Butterfly Index’. It uses historical data to generate expected numbers for a biome (or a site if a checklist exists) and assigns a score of 1-5 to each count. The index is calculated using this formula:
n represents the species-count from a site
F is the relevant percentage factor from the Biome or Locality table
Ax = 1+ (n / (10 * F)) 1/1.5
Biome factors (Fb) are indicated in the table below. In instances where records are obtained from a locality with an established checklist, Locality factors (Fl) are used instead.

Abundance index table
Jeremy uses these figures to run a light-hearted provincial contest:
- Each Province receives a monthly rating between 1 (Very Poor) and 5 (Excellent).
- Lesotho and Swaziland are included as Provinces.
- The rating is based on the highest recorded individual monthly species-count within the province under consideration.
- The numbers are based on representatives of the Papilionoidea superfamily (traditional butterflies).
- In instances where data is acquired from several biomes within a single Province, the highest rating will be used.
Jeremy has generated this graphic:

Butterfly index trends for SA
He averaged the values for the last five years (red line) and compared this with a hypothetical “ideal” (black line) and this year’s scores (blue line). No real trends have emerged yet, other than that butterfly abundance in the summer months is significantly less than “ideal” whereas in winter the numbers are generally higher!
These stats are highly processed and don’t work on averages, but on maxima. They don’t have any individual species or site data like the BCUK studies do. I wondered if LepSoc’s KZN dataset held any trends we could try to correlate with local weather data. So, I asked Jeremy to provide me with the five years’ monthly raw dataset of ‘Butterfly Index’ for KwaZulu-Natal, so I could try to find a way to correlate them with weather data.
To give you, dear reader, a break between two chunks of maths and charts, here are a few recent local sightings!
Local butterfly sightings in 2023

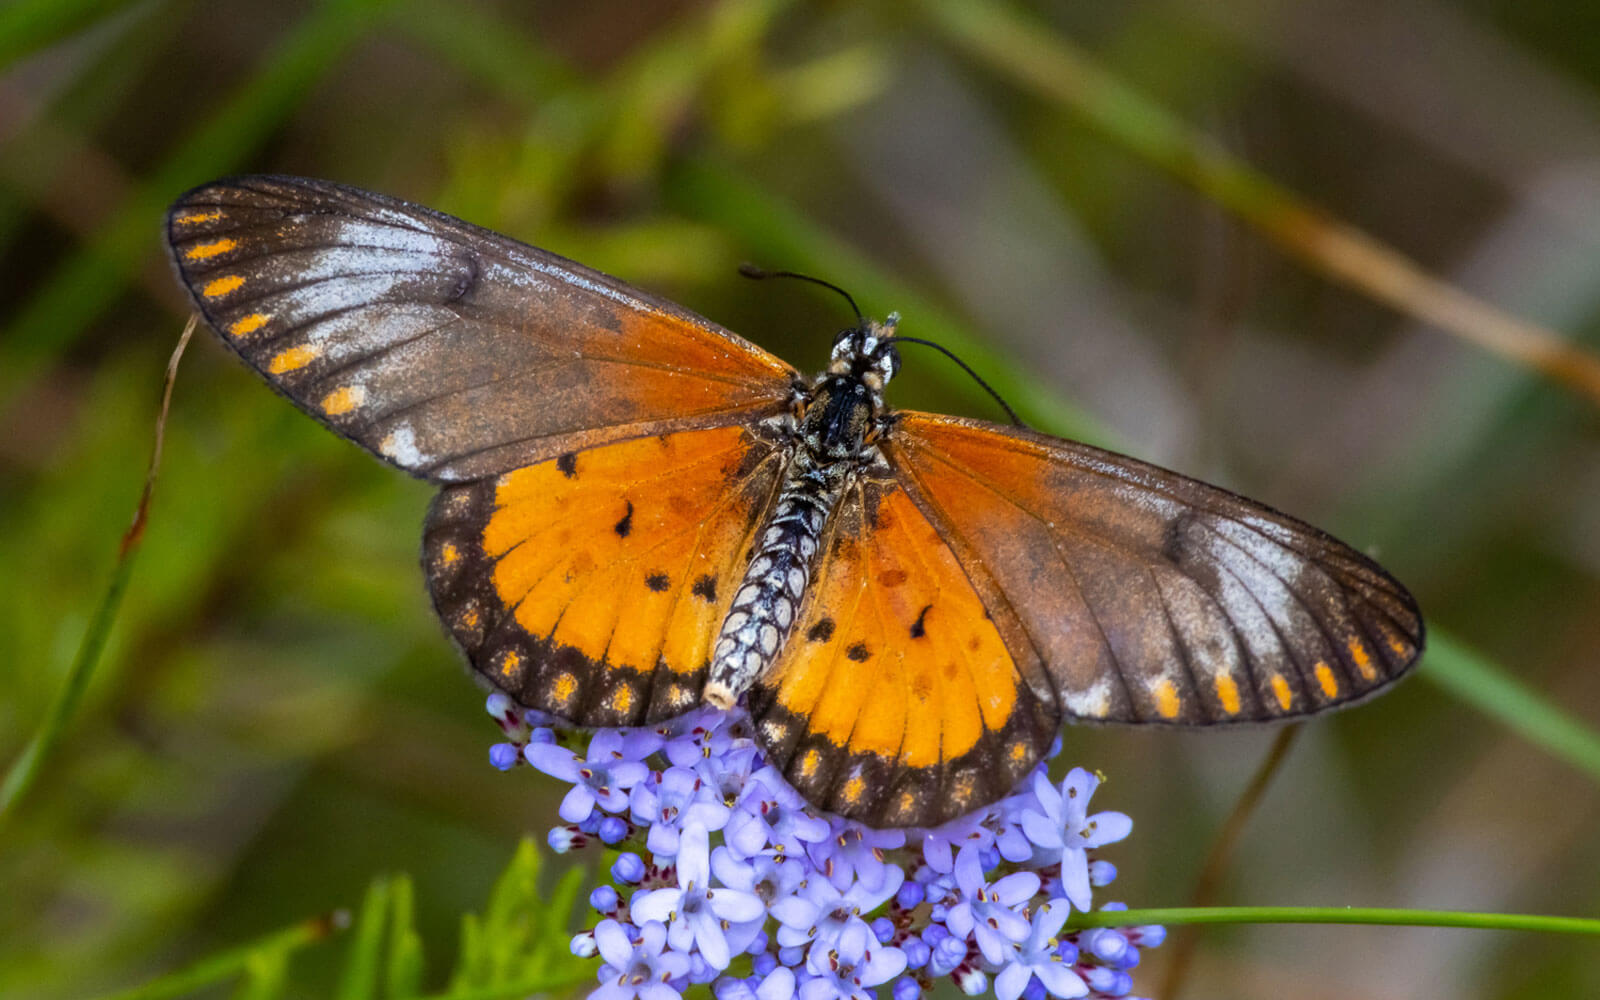
Blonde Glider Cymothoë coranus is more of a coastal species and rarely ventures ‘up the hill’. The female was photographed at iPhithi Nature Reserve in Gillitts recently.

Painted Lady Vanessa cardui, one of the ‘super migrators’ mentioned in a previous LE article. This freshly emerged male was found nectaring on Canary Creeper Senecio tamoides on the same day as the Blonde Glider. There always seems to be a peak of emergence in autumn and winter. I wondered where he might be bound for when he migrates…

Weather data
Unlike my friends in the UK, long term accurate weather data isn’t available for free from the government in SA. I went onto Google and found Visual Crossing. This is a plug for them because they allowed me do download, for free, the dataset I used to produce the following charts. Thanks Sean McCafferty and the guys in Tech Support! The dataset comes from multiple stations in the Durban area, and it was very easy to convert from a .csv file to MS Excel.
Armed with this, and MS Excel’s charting inserts, I set out to hunt for relationships – correlations and trend patterns.
Correlations?
First, I looked for correlations using X-Y scatter charts. None of the monthly data showed any significant correlation between Butterfly Index and any of the weather data. The correlation coefficient R2 is a measure of significance. The coefficients for the monthly plots were all close to zero. So, I looked at the yearly data, which is more highly consolidated and may show some relationships.
What role does yearly total rainfall play?

This is what statisticians call ‘weak support’! We don’t have that many yearly data, and a plot of monthly data showed no correlation at all. The correlation coefficient of R2 = 0.4619 shows that there is a relationship: more rain in a year, fewer butterflies on average.
Would there be a correlation between last year’s rainfall and the following year’s butterfly index?

Answer: almost none! Admittedly it’s a stretch to look for significant statistics from only five records… R2 = 0.1626 shows that heavy rain last year appears to have a positive impact on this year’s butterflies, and at least the line is in the right direction.
What role does average temperature play?

Answer: quite a big role! This chart, with R2 = 0.7037, shows that warmer weather = more butterflies. As they found in the UK survey. The average cloud cover data per year showed almost no correlation: R2 = 0.0154. That’s what the statisticians call ‘zero support’! I won’t waste your time by showing you the chart.
Before we look at trends, let’s have a short break with more recent butterfly images…
More local butterfly sightings in 2023

In April the signs were clear that we were in for a bumper season. The wet grasslands at Msinsi Grassland were full of little yellow flowers, which I think are Brass Buttons Cotula coronopifolia but no-one has offered me a convincing identification yet. And the butterflies were having a ball. There are four species in this shot but there were many more besides.
We saw a few Dancing Telchinias, Telchinia serena, in Msinsi. This is a male; they always look the same. This species was about to have one of its spectacular swarm seasons. Not long afterwards, lepidopterists were reporting huge numbers in the grasslands and savannas from the Free State to Limpopo.


During the City Nature Challenge from 28 April 2023 to 1 May, Dancing Telchinias, Telchinia serena, were everywhere as the swarm hit Durban. No two females are every exactly alike, as these four images show. Black, white, bright orange, buff, and transparent markings riff around a central pattern theme. This butterfly was the second most often uploaded species during eThekwini’s CNC.
Trends?
The next place to look was long term monthly trends. 5½ years of data allows a 12-month moving average to be calculated for 4½ years. Plotted against time, that shows year-on-year changes and has a good chance of detecting significant trends.

The trend in Butterfly Index (yellow) shows a strong peak in summer 2019-2020, as the rainfall trend (red) was static or moving slightly downwards. From 2021 the Butterfly Index trend was downwards, as rainfall was increasing… and then came the April 2022 floods. This year the rainfall has trended downwards and there are more butterflies. We can probably look forward to a couple of bumper butterfly years as all that plant biomass works its way through their populations.

These two trends are in step. Rising monthly temperature coincides with rising Butterfly Index, and vice versa. This agrees with the X-Y chart, and as we know, butterflies are temperature sensitive, so this is not really surprising. Warm temperatures with plentiful plant biomass from 2022 should ensure plenty of butterflies into 2024.

This chart shows clear alignment of trends and agreement with the UK observation that increased cloud cover leads to reduced butterfly abundance. Being solar-powered, cloudy weather puts a damper on their activities like mating and feeding. It’s an exciting chart in that it appears that a fall in the cloud cover average can predict an increase in butterfly abundance!

There’s an interesting relationship here between temperature and rainfall. In autumn 2019 there was a rainfall peak as temperature was falling towards winter. In 2020 the temperature trend was upwards as the rainfall trend fell… perfect conditions for butterflies, which as the previous charts show, had a bonanza in Autumn that year. In 2021 the temperature peak was lower, but the trend was flat, and there was no late summer rainfall peak that year, like in 2020. Butterfly numbers fell, and 2022 had a huge autumn rainfall spike. This kept their numbers down, but this year there has been relatively little late rainfall and the temperature is trending upwards…
So what? I hear you saying…
First of all, a nice butterfly image…or two…

Everywhere we went during CNC2023, and in the preceding weeks, the grasslands were full of beautiful fresh specimens of Pale Smoky Blue Euchrysops barkeri. There were lots of small Fabaceae forbs, on which the larvae feed, so this butterfly was having a peak. Normally the females, shown here, vastly outnumber the males, which are seldom seen. But…

This year we saw male Pale Smoky Blues. And at last I got a photo of a perfect one with his wings wide open!
To sum up, I think it’s good news that, despite the limitations of our local butterfly data, this study appears to show agreement with the vastly more detailed UK work:
- Butterfly numbers are less when it’s cloudy and dull.
- And if it rains more, that also means fewer butterflies.
- But more rain leads to increased plant biomass, so a year with a warm dry autumn following a cool rainy summer in the previous year has a great chance of being a bumper butterfly year.
- That was the case in 2020, and looks like being the case in 2023, and probably 2024 as well.
There are some things we could improve on going forward. Such as…
- Provide a framework for regular standardised butterfly counts, in terms of numbers seen over a specific transect at regular time intervals. The ‘Pollard Walk’ methodology is used extensively by BCUK, who provide a data gathering and analysis function. They are easy to do and the count is made against a standardised checklist for the locality, so you don’t need to be a great expert lepidopterist to take part. The good news is that I have it on good authority that LepSoc Africa has something up their sleeve here.
- Gather data over a long enough time frame to control for temperature and rainfall fluctuations over a ~7 to 8-year cycle – La Niña or El Niño – and prepare to detect extremely long-term trends. Ultimately, we don’t know if the changes in abundance we’re seeing are caused by long term climate change, pesticides, or simply regular climate fluctuations.
- Group data at species and genus level to be able to differentiate for butterflies that live in different habitats and may have different generational lengths. We have some information here for the subtropical KZN coastal biome… how different will it be for fynbos or grassland species?
Butterfly Conservation UK (BCUK) uses the ‘UK Butterfly Monitoring Scheme’ or UKBMS to count butterflies in an organised way. This has been expanded to the ‘Continental Butterfly Monitoring Scheme’ of ‘CBMS’, which is going global. It’s already spread across Europe and as far as Japan. Recently an agreement was made with the Lepidopterists’ Society of Africa to roll it out across our continent. This should happen before the end of 2023. More announcements will follow…….

Steve Woodhall is a butterfly enthusiast and photographer who began watching and collecting butterflies at an early age. He was President of the Lepidopterists’ Society of Africa for eight years, and has contributed to and authored several books, including Field Guide to Butterflies of South Africa and Gardening for Butterflies. His app, Woodhall’s Butterflies of South Africa, is described as the definitive butterfly ID guide for South Africa.